1. Understand the Air Quality Problem
Duration1h15Learning Objectives
Analyze:
[BC02] a first, well-justified set of hypotheses about a new dataset, formed through open-ended exploration rather than a fixed checklist
Air Quality in African Cities
Context
Air pollution is one of the leading environmental health risks worldwide. Fine particulate matter (PM2.5) is particularly dangerous because it penetrates deep into the lungs and bloodstream. Ground-level PM2.5 sensors are expensive and unevenly distributed, especially across African cities, so researchers increasingly rely on satellite measurements (from the Sentinel-5P mission) to estimate ground-level pollution where no physical sensor exists. You have been asked to build a first model that predicts PM2.5 concentration from satellite measurements, and to check whether a model trained in one city can be trusted in another city where it has never measured anything.
Data Description
For this activity you will work with a reduced dataset: measurements from two cities, Kampala and Nairobi.
| Variable | Meaning |
|---|---|
| city | City where the measurement was taken (Kampala or Nairobi in this activity) |
| date | Date of the satellite pass |
| hour | Hour of the satellite pass (UTC) |
| site_latitude | Latitude of the monitoring site |
| site_longitude | Longitude of the monitoring site |
| pm2_5 | Ground-level PM2.5 concentration (µg/m³) — the target variable |
| sulphurdioxide_so2_column_number_density | Sulphur dioxide (SO2) column density, from satellite |
| carbonmonoxide_co_column_number_density | Carbon monoxide (CO) column density, from satellite |
| nitrogendioxide_no2_column_number_density | Nitrogen dioxide (NO2) column density, from satellite |
| formaldehyde_tropospheric_hcho_column_number_density | Tropospheric formaldehyde (HCHO) column density, from satellite |
| uvaerosolindex_absorbing_aerosol_index | UV absorbing aerosol index |
| ozone_o3_column_number_density | Ozone (O3) column density, from satellite |
| uvaerosollayerheight_aerosol_height | Aerosol layer height |
| cloud_cloud_fraction | Cloud cover fraction |
Understanding CRISP-DM
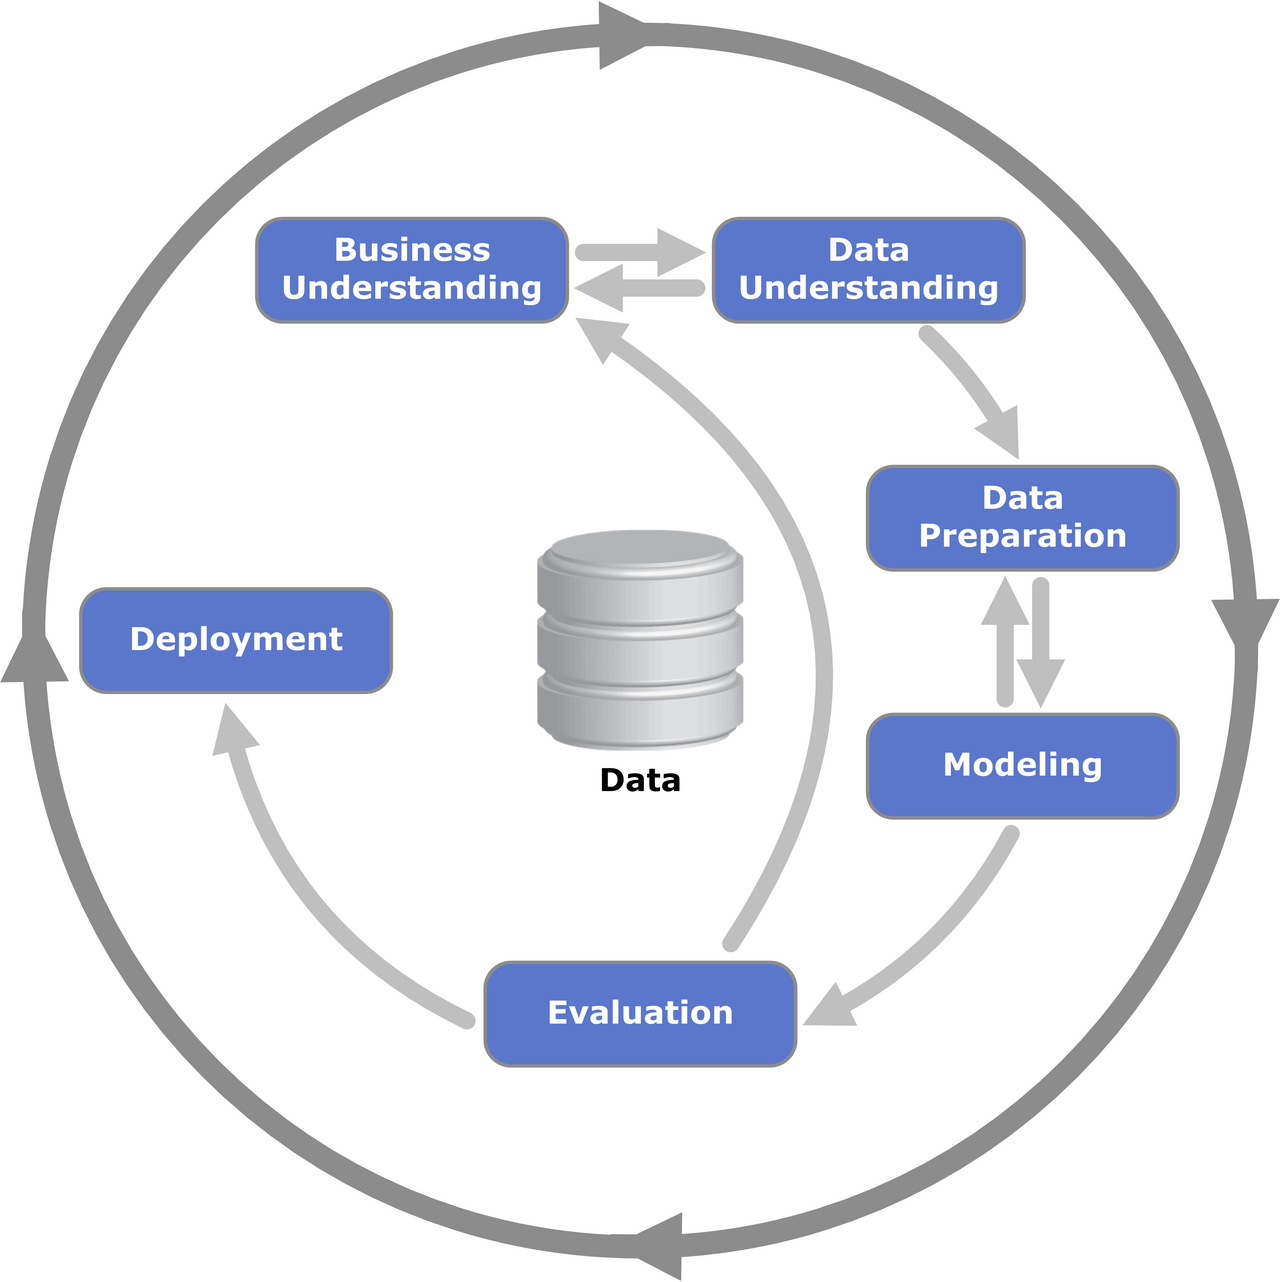
Data science projects tend to follow a similar overall process, formalized as CRISP-DM (Cross-Industry Standard Process for Data Mining): Business Understanding, Data Understanding, Data Preparation, Modeling, Evaluation, and Deployment. You will not go through all six phases in a single session, but recognizing which one you are in helps you ask the right questions at the right time.
This activity covers the first two:
- Business Understanding (“Understanding the problem” below): understanding the problem, the stakeholders, and what a useful model would need to achieve, before touching any data.
- Data Understanding (“Notebook” below): exploring the data itself to see what it actually contains, independently of any modeling choice.
Understanding the problem
Files: reflection/session_2/module_1.md
Details
Question 1: What information is already available in the problem statement? What is missing (e.g., how many monitoring stations, over what time period, how PM2.5 was measured on the ground)?
Details
Question 2: Who would use a model that predicts PM2.5 from satellite data, and for what decision? What would make such a model trustworthy to them?
Details
Question 3: pm2_5 is the target variable. Which other variables do you expect to be genuinely informative predictors, and which ones look more like identifiers than physical measurements?
Details
Question 4: Suppose you train a model only on Kampala data. What could go wrong when you apply it to Nairobi? List at least two concrete risks.
Details
Question 5: Describe the expected type, measurement scale, and analytical role of every variable.
| Variable | Expected type or scale | Possible analytical role |
|---|---|---|
| city | ||
| date | ||
| hour | ||
| site_latitude | ||
| site_longitude | ||
| pm2_5 | ||
| sulphurdioxide_so2_column_number_density | ||
| carbonmonoxide_co_column_number_density | ||
| nitrogendioxide_no2_column_number_density | ||
| formaldehyde_tropospheric_hcho_column_number_density | ||
| uvaerosolindex_absorbing_aerosol_index | ||
| ozone_o3_column_number_density | ||
| uvaerosollayerheight_aerosol_height | ||
| cloud_cloud_fraction |
Notebook
Files: notebooks/session2/01_discovery.ipynb
Get the project running
Download the Air Quality project archive and unzip it inside your course workspace (the same ~/data-science-toolkit workspace you created in Session 1):
From the project directory, install the base environment and open the notebook in VS Code:
|
|
Open notebooks/session2/01_discovery.ipynb and select the .venv kernel of this project, exactly as you did for the Sales notebook in Run a Notebook in VS Code.
Explore
There is no fixed answer here: the goal is to build hypotheses, not reusable code. Look in particular at:
- How
pm2_5is distributed in each city - Whether there is a visible trend or seasonality over time
- Which columns have missing values, and how many, per city
- Whether any satellite variable looks correlated with
pm2_5— a quick correlation heatmap is enough for now; Session 3 has a dedicated module to do this analysis properly
Info
Keep a few notes on what you observed — you will reuse them when interpreting the model you build in the next activity.