2. Build a First Pipeline
Duration2h30Learning Objectives
Apply:
[BC07] a first, complete modeling pipeline, built and run end to end
Analyze:
[BC07] why a feature that looks informative can actually destabilize a model, and when it should be left out
[BC07] the logic of an end-to-end modeling process — why cleaning, feature engineering, training and evaluation have to happen in that order, not just what each step does
Prerequisites
Introduction
You will now build the smallest complete Machine Learning pipeline: load, clean, split, engineer features, train, evaluate. Every step matters, but the most important one is the split: instead of shuffling all rows together, you will train on one city and test on another. A model that only works on the city it was trained on is not a model you can trust anywhere else.
Notebook
Files: notebooks/session2/02_pipeline.ipynb
Open it and select the same .venv kernel you used in the Notebook section of the previous activity. Complete each # TODO cell in order.
Step 1 — Load and restrict the scope
Load data/train.csv, keep only Kampala and Nairobi and the columns listed in COLUMNS, then cap the sample at 1200 rows per city (random, random_state=42) so the pipeline stays fast to run and easy to inspect.
Step 2 — Clean missing values
Some satellite passes are missing for some columns. Fill them within each city, sorted by date (forward-fill then backward-fill). Never let one city’s values fill another city’s gaps — that would be a geographic data leak before you even reach the model.
Step 3 — Manual split by city
No random shuffling of rows. train_df is one city, test_df is the other. Testing on data the model never trained on is the basic way to check that it actually generalizes. Later, in Session 3, you will see a more systematic way to do this across several groups at once — cross-validation.
Step 4 — Temporal features
Extract month and dayofweek from date. Pollution often follows seasonal and weekly patterns (traffic, economic activity).
Step 5 — Baseline model and evaluation
Train a plain LinearRegression and evaluate it with RMSE, MAE and R². The notebook explains why site_latitude/site_longitude are deliberately left out of the features — read it before you try adding them back.
Reflection
Files: reflection/session_2/module_2.md
Details
Question: Run the pipeline again, but train on Nairobi and test on Kampala instead. Compare the two RMSE values. What does the difference tell you about how well a model generalizes from one city to another? Would you trust either direction enough to deploy it?
Info
In Session 3, you will see how to automate this kind of comparison across more than two cities at once, using GroupKFold.
Details
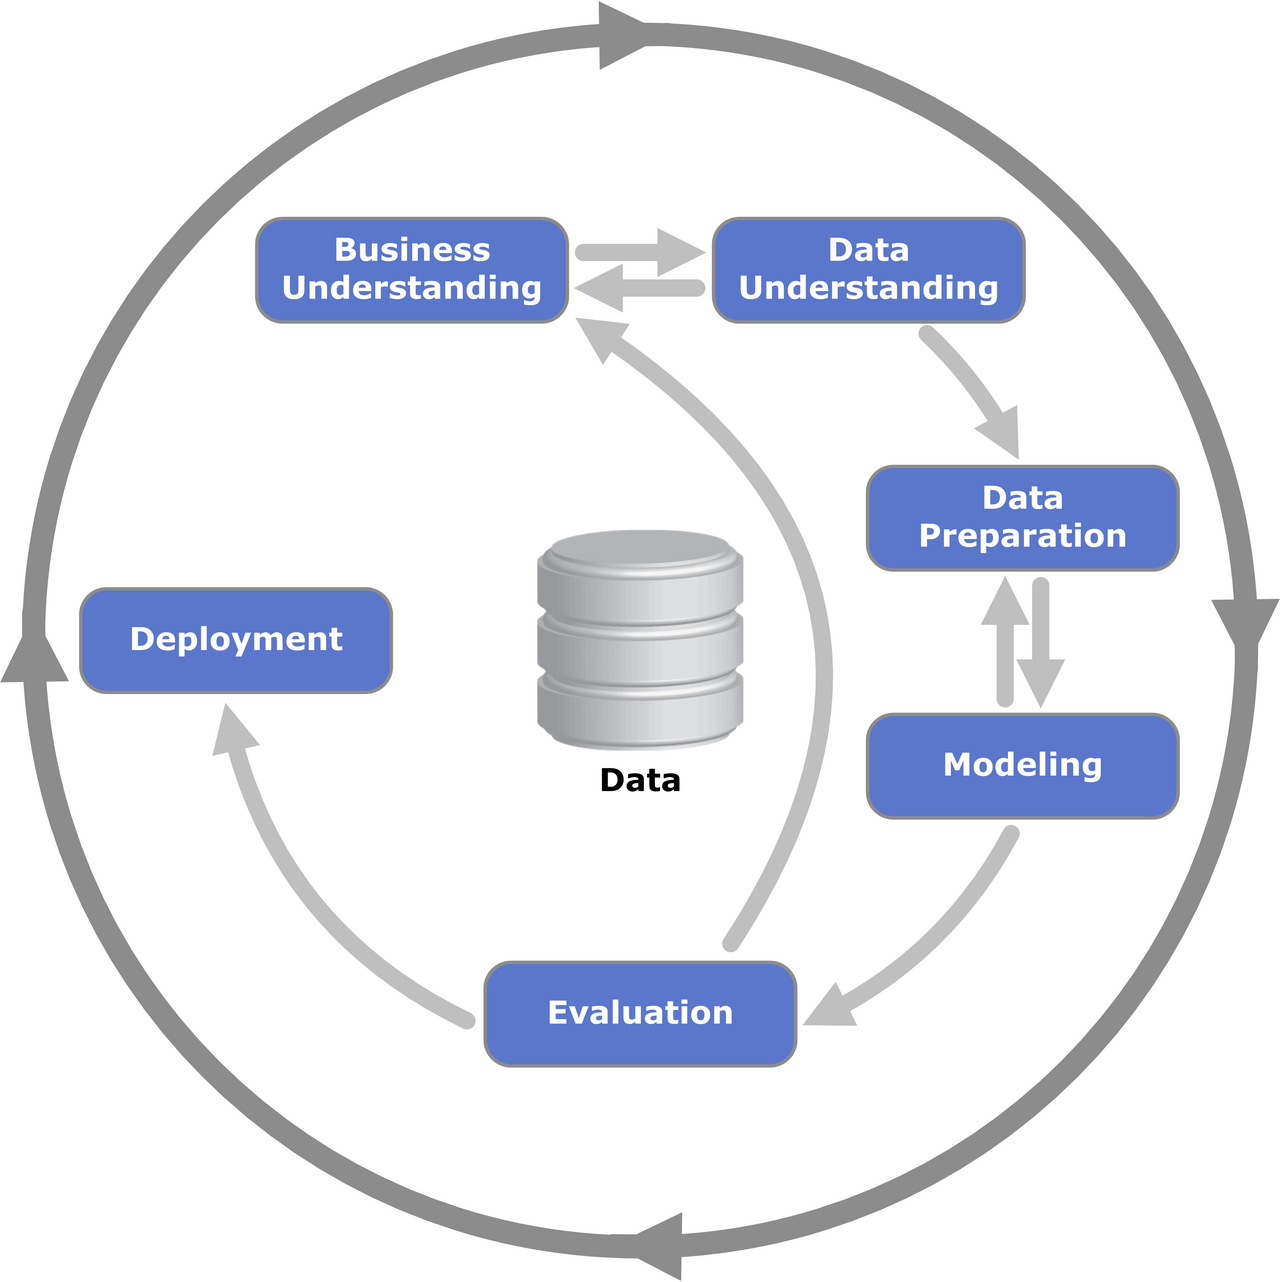
Question: Across Understand the Air Quality Problem and this activity, which CRISP-DM phases have you already gone through? Which phase does building and evaluating this baseline pipeline itself belong to?